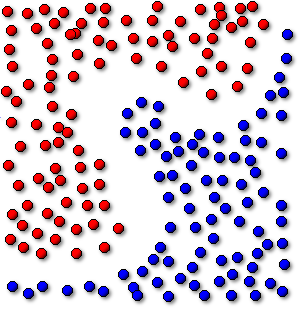
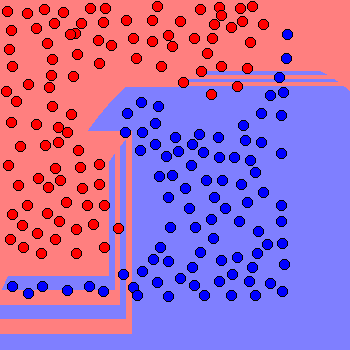
Figure 1
A synthetic dataset for our classifier to work on. It is simple enough, but devising a function to divide the two classes may be tricky.
Genetic Programming (GP) has been shown to be a competitive technique for the automatic development of classification algorithms. Depending upon the library of parameters you supply, Genetic Programming has the capability (theoretically at least) to develop arbitrarily complex, non-parametric solutions to model classification problems.
Although there are many operator sets that one can use to generate classifiers using Genetic Programming, a popular approach uses an operator set consisting mainly of mathematical and logical functions to transform the feature vector into a one dimensional output value. The correct class for a given output is then decided by a so-called program classification map, which comprises a series of ranges, each of which is associated with a class. When the program processes a data point and returns a particular value, the relevant slot is looked up on the map and the associated class returned.
The classes associated with each slot in the map can be assigned either statically or dynamically. In so-called dynamic range selection (DRS) the association of classes to slots is performed at runtime, customised for each GP program. In a previous study by [1], DRS was shown to be the most competitive with other GP classification techniques when tested on public classification datasets.
Since Genetic Programming is essentially a black box approach, it is quite difficult to assess why a classifier performs well, or (more importantly) why it fails to do so. Although it isn’t possible to visualise the way a classifier makes decisions in the high dimensional space that most classification problems inhabit, we can develop a simple two dimensional dataset that we can visualise easily, see Figure 1. You can download the dataset as a CSV file to try it yourself if you like.
Figure 1
A synthetic dataset for our classifier to work on. It is simple enough, but devising a function to divide the two classes may be tricky.
What kind of a function set can be used to solve classification problems using GP? Here's a list that I commonly use:
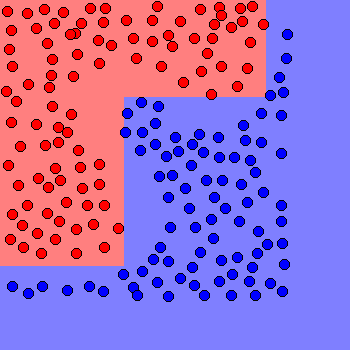
Since we’re in only two dimensions, we can plot the decision of the classifier evolved by genetic programming at every point on an image to see the decision boundary. This allows us to visualise the kind of solutions the GP classifier is capable of, and may also indicate the kind of capabilities that your operator set is missing.
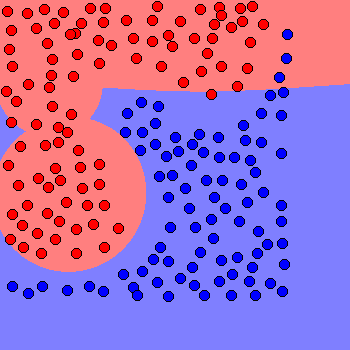
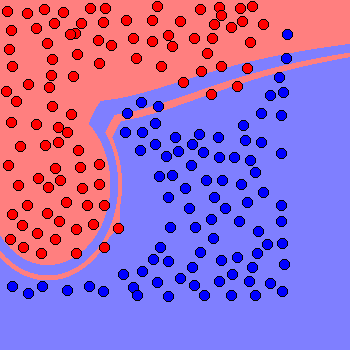
Lets have a look at a few solutions, all developed using the same problem definition, but using different random seeds. Each took about 1 minute to evolve. While all these solutions have quite high fitness, on a subjective basis you may feel that some solutions are much better than others.
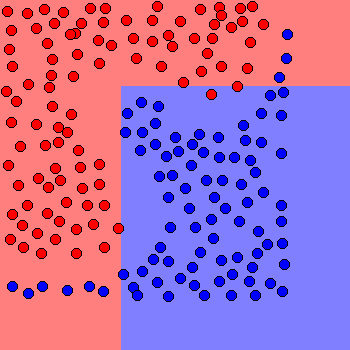
Lazy
Better, but making a few mistakes
Probably unreliable on unseen data
High fitness, but bizarre
100% correct classification, but the margins are pretty tight
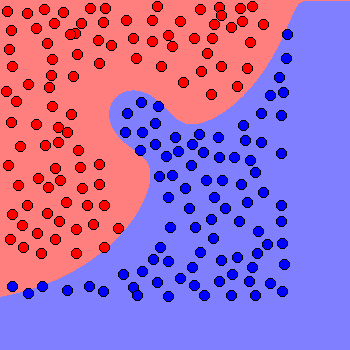
Close to the kind of thing a human would do
Looking at the actions of classifiers in two dimensions can give an interesting insight into how the black boxes developed by a Genetic Programming system actually work. Sometimes they are elegant, other times the GP system will find simple ways to "cheat", and a few times the system will come up with something quite bizarre. Clearly some solutions appear to be better than others, and some will be more capable of generalisation than others. Translating the subjective analysis of a classifier in this way into new strategies for improving your GP classification set up is not easy, but it can give you some clues as to how to proceed.
Olly Oechsle