Java Function Plotter 1.1
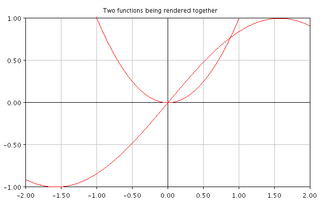
This Java program allows you to plot mathematical functions or basic charts. You supply a formula and the program will
draw it for you on a line graph. I wrote this to make sure that the Gaussian Probability function I was writing
was outputting the correct results.
The GraphPanel object allows you to add these graphs into your Java Swing applicationa easily. The InteractiveGraphPanel
is an extention to GraphPanel, which allows the user to move around the graph by dragging the mouse, and zoom in and out
with the scroll wheel.
You should note that this is not fully tested software - it works well for my purposes by it may not work for yours!
Nonetheless, you may find it of use, and indeed you may like to have a starting point for making graphing software of your own.
If you need more serious graphing software for Java, you may want to look at jfreechart
Features
- Plot continuous mathematical functions
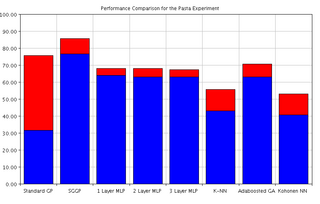
- Plot discrete functions using Bar Charts or CandleStick Plots
- Add these charts to your Swing Applications easily
- Create interactive charts using the InteractiveGraphPanel object (NEW)
- Save charts to popular image formats easily
- Demo Swing GUI
- Control the settings and appearance of your graph via the PlotSettings object (NEW)
More Information
Have a look at the following code files to see how to use it: Demo.java shows how to create
a simple graph. GraphApplication shows how it can be implemented into a Java SWING application.
The classes SineWave.java and Gaussian.java show Java implementations
of Sine Wave and Gaussian Probability Functions respectively.
A simple way to visualise a mathematical function:
Graph rendering code is in Graph.java, have a look if you want to.
Please feel free to extend it and me your updates!
Contact Me
ooechs {at} essex {dot} ac {dot} uk